
Core Technologies Behind Modern Air Quality Monitoring Sensors
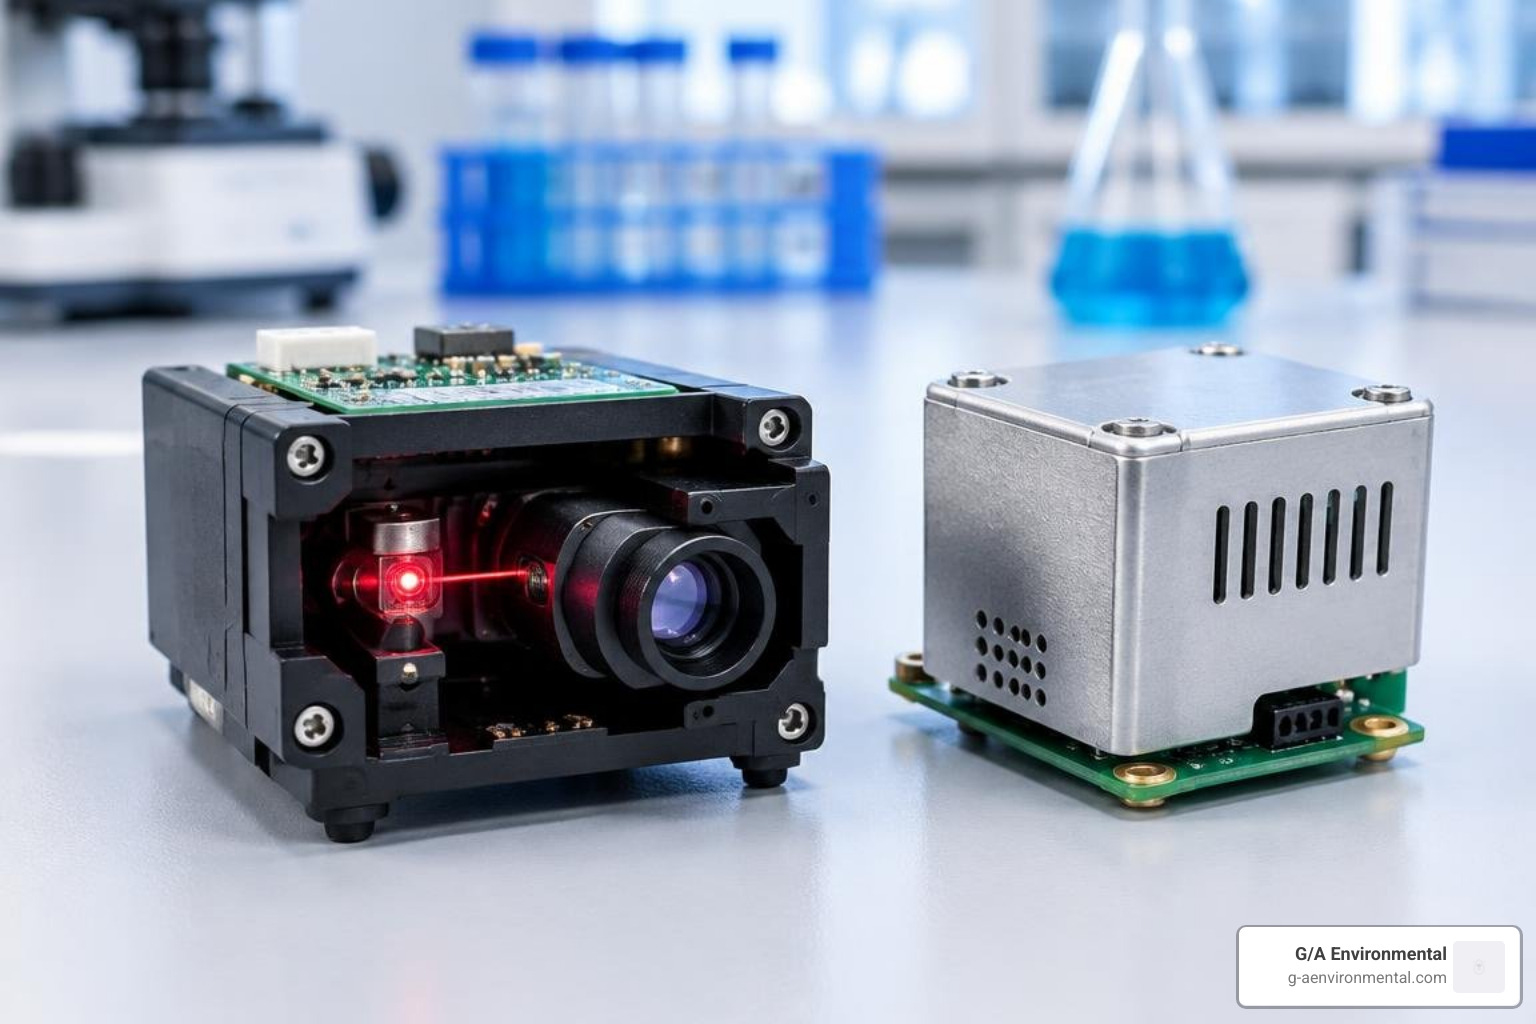
Air quality monitoring sensors tell you what is actually present in the air you breathe by measuring specific particulate and gas concentrations in real time. They track fine and coarse particulate matter, carbon dioxide, volatile organic compounds, and targeted gases such as formaldehyde and carbon monoxide, revealing ventilation efficiency, chemical off-gassing, and environmental hazards before they become visible or symptomatic. Modern devices rely on miniature physical and chemical detection systems working simultaneously. Decades ago, monitoring ambient air required bulky, climate-controlled stations. Today, solid-state micro-electro-mechanical systems (MEMS) and miniaturized optical assemblies allow us to capture complex environmental parameters inside compact enclosures.
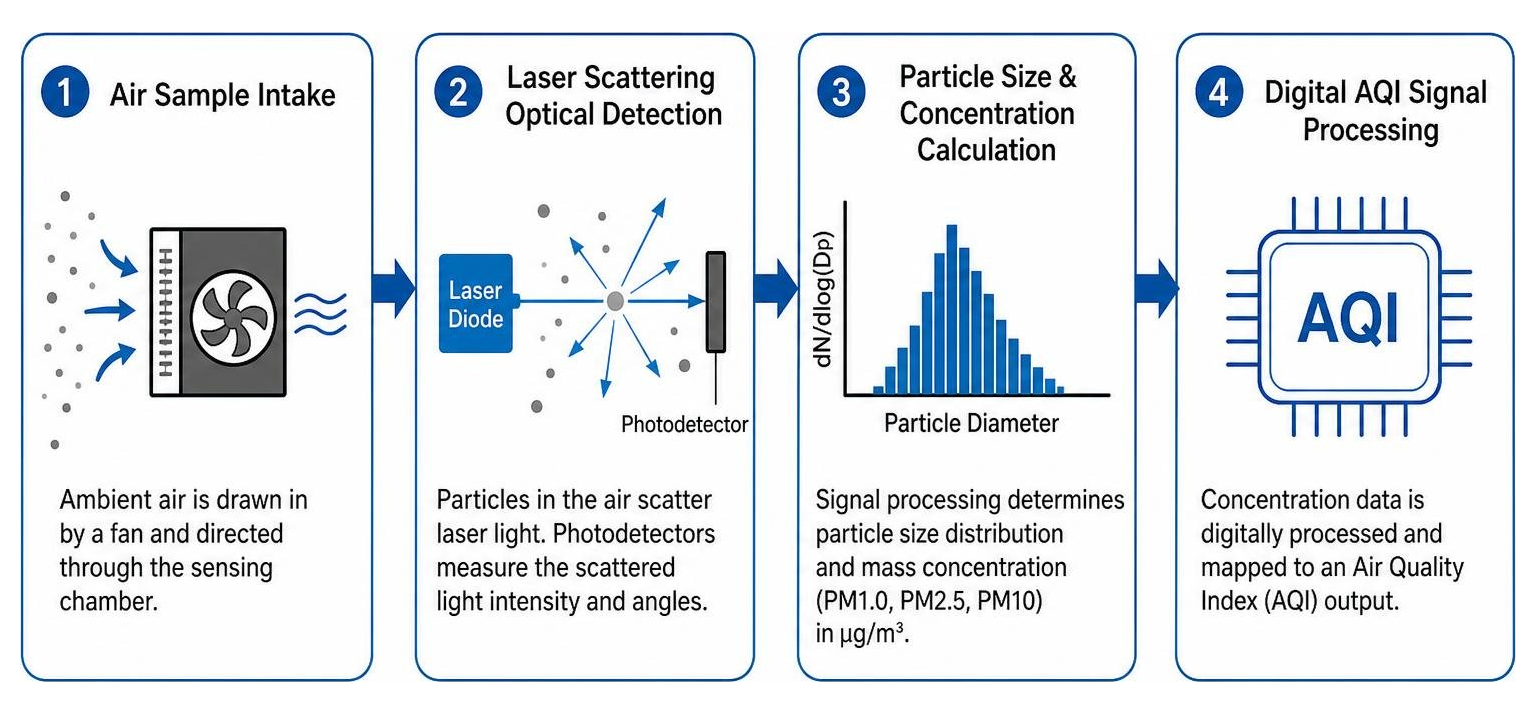
Understanding what your hardware is actually reading requires looking beneath the casing at the primary sensing mechanisms:
- Optical Particle Counters (Laser Scattering): Particulate matter (PM) sensors pull ambient air through a small dark chamber using a miniature fan or thermal resistor. A laser diode illuminates the incoming air stream. When suspended particles cross the light beam, they scatter photons in various directions. Photodetectors measure the intensity and angular distribution of this scattered light to calculate particle diameter and mass concentration (from PM1.0 up to PM10) in micrograms per cubic meter ($\mu\text{g/m}^3$).
- Non-Dispersive Infrared (NDIR) Carbon Dioxide Sensors: NDIR sensors measure carbon dioxide ($\text{CO}_2$) by utilizing infrared light absorption. Carbon dioxide molecules absorb specific wavelengths of infrared radiation (typically $4.26\,\mu\text{m}$). The sensor projects an infrared beam through an optical tube containing ambient air; a narrow optical filter on the opposite end measures light attenuation. The degree of light absorption directly corresponds to the volumetric concentration of $\text{CO}_2$ in parts per million (ppm).
- Metal Oxide Semiconductor (MOS/MOX) Sensors: Used primarily to track Total Volatile Organic Compounds (TVOC) and oxidizing gases such as nitrogen oxides ($\text{NO}_x$), MOX sensors consist of a heated metal oxide film (often tin dioxide). As target gases interact with the oxygen ions adsorbed on the semiconductor surface, electrical conductivity changes. High-performance modules like the SEN65 multi-parameter sensing platform translate these resistance shifts into normalized relative indices, allowing continuous indoor tracking over long lifespans.
- Electrochemical Cells: These sensors detect targeted reactive gases such as carbon monoxide ($\text{CO}$), formaldehyde ($\text{HCHO}$), sulfur dioxide ($\text{SO}_2$), and ozone ($\text{O}_3$). Ambient gas diffuses through a permeable membrane into an electrolyte solution, creating a reduction or oxidation reaction at the sensing electrode. This reaction generates an electrical current proportional to the gas concentration in parts per billion (ppb) or ppm.
The Overlooked Role of Differential Pressure and Environmental Dynamics
Many facility operators overlook the profound impact that barometric and differential pressure exert on air quality metrics. Barometric pressure changes naturally influence the dispersion of indoor pollutants and the intrusion rate of outdoor contaminants.
Inside commercial buildings, micro-differential pressure sensors—capable of resolving changes with error margins down to 0.10%—measure the pressure drop across air filters and between adjacent spaces. An elevated pressure differential across an air handling unit indicates filter loading, signaling that particulate capture efficiency is dropping while fan energy consumption is spiking.
Furthermore, temperature and relative humidity directly affect chemical reaction rates on MOX and electrochemical surfaces and cause hygroscopic particulate matter to swell with water vapor. Advanced hardware, such as the 8-in-1 advanced IAQ monitor, incorporates integrated temperature and humidity compensation algorithms alongside NDIR and electrochemical modules to prevent artificial reading spikes caused by damp air.
How Wireless Air Quality Monitoring Sensors Transmit Critical Data
Connecting physical sensing hardware to building management workflows requires dependable telemetry:
- LoRaWAN: Operating on license-free sub-gigahertz radio bands (such as US915), LoRaWAN provides communication ranges exceeding several miles with penetration through heavy concrete and steel floors. Because sensor nodes transmit small data packets intermittently, battery-powered units can operate for years without maintenance.
- Wi-Fi & MQTT: Ideal for continuous, high-frequency line-powered installations. Microcontrollers stream live 1 Hz environmental arrays directly to cloud servers or local building automation systems using lightweight, encrypted MQTT-over-TLS protocols.
- Bluetooth Low Energy (BLE): Useful for mobile field audits, fast initial provisioning, and direct broadcast beacons that deliver localized air metrics to smartphones and digital signage without requiring access to secure corporate network infrastructure.
- Edge Computing and Remote Logging: Advanced nodes log sensor output to internal flash memory during connectivity dropouts, syncing data retroactively to prevent gaps in environmental compliance records.
Decoding Sensor Metrics: Key Pollutants and Diagnostic Insights
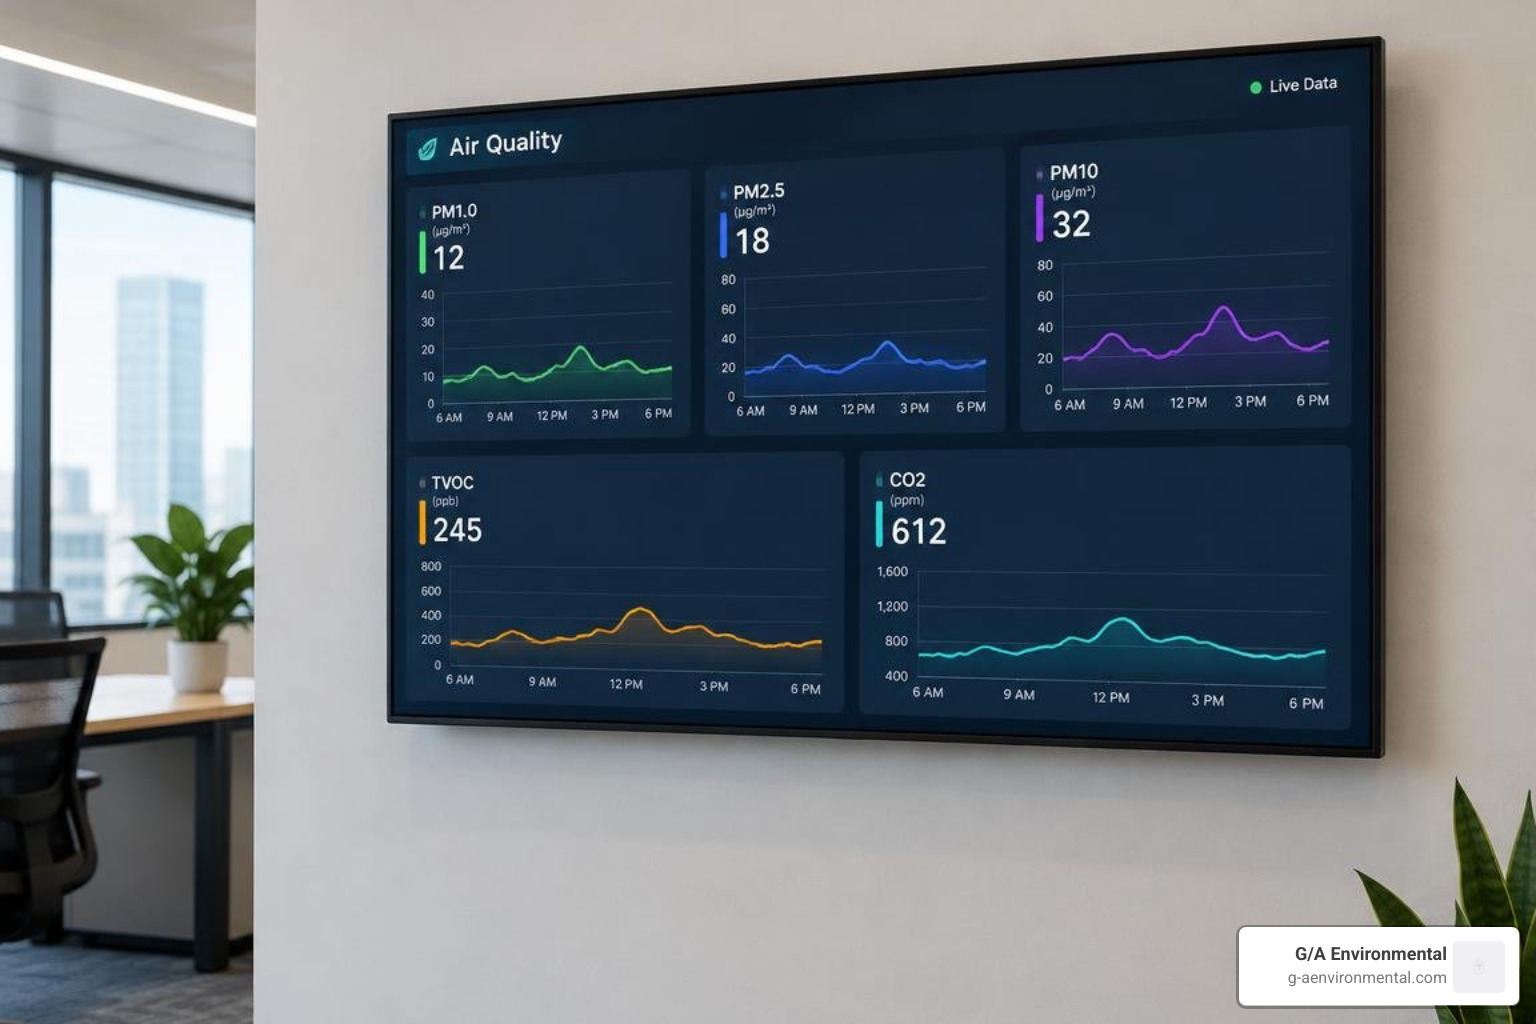
A sensor dashboard provides numerical values across multiple parameters, but interpreting those numbers requires understanding the physical sources and diagnostic implications behind them.
- Ultrafine and Fine Particles (PM1.0 & PM2.5): Particles smaller than $2.5\,\mu\text{m}$ pose the greatest respiratory hazard because they travel deep into lung alveoli and can enter the bloodstream. While cooking, combustion, and outdoor wildfire smoke generate substantial fine particulates, sudden unexplained baseline shifts in dusty commercial spaces require physical inspection to rule out regulated materials.
- Coarse Particulate Matter (PM10): Ranging from $2.5\,\mu\text{m}$ to $10\,\mu\text{m}$, these coarse particles include outdoor road dust, pollen, mechanical debris, and deteriorating building substrates.
- Total Volatile Organic Compounds (TVOC): TVOC readings reflect a composite index of organic chemicals off-gassing from paints, varnishes, cleaning solvents, adhesives, and furnishings. Elevated baseline TVOC levels suggest inadequate outdoor air exchange or persistent chemical emissions.
- Formaldehyde (HCHO): A specific, highly irritating VOC released by pressed-wood furniture, subflooring resins, insulation, and adhesives. Because standard MOX sensors cannot isolate formaldehyde, dedicated electrochemical sensors are used to monitor ppb concentrations in newly constructed or renovated spaces.
- Combustion Gases (CO, NO₂, SO₂): Carbon monoxide and nitrogen dioxide point to backdrafting furnaces, vehicle exhaust intrusion from loading docks, or unvented combustion appliances.
When elevated particulate matter coincides with sustained high relative humidity, it frequently indicates condensation issues and moisture accumulation that warrant thorough mold testing and inspection before microbial colonization damages building infrastructure.
| Parameter / Pollutant | Primary Sensing Technology | Typical Clean Baseline | Elevated / Warning Threshold | Common Indoor & Outdoor Sources |
|---|---|---|---|---|
| PM2.5 | Optical Laser Scattering | $< 10\,\mu\text{g/m}^3$ | $> 35\,\mu\text{g/m}^3$ (24-hr avg) | Wildfire smoke, cooking, vehicle exhaust, combustion |
| PM10 | Optical Laser Scattering | $< 20\,\mu\text{g/m}^3$ | $> 150\,\mu\text{g/m}^3$ (24-hr avg) | Dust resuspension, construction debris, mechanical wear |
| CO₂ | Non-Dispersive Infrared (NDIR) | $400 – 600\text{ ppm}$ | $> 1,000\text{ ppm}$ | Human respiration, unvented combustion, inadequate HVAC |
| TVOC | Metal Oxide Semiconductor (MOX) | Index $< 100$ (or $< 200\,\mu\text{g/m}^3$) | Index $> 250$ (or $> 500\,\mu\text{g/m}^3$) | Cleaning agents, fresh paint, off-gassing carpets/sealants |
| Formaldehyde (HCHO) | Electrochemical Cell | $< 20\text{ ppb}$ | $> 50\text{ ppb}$ | Pressed-wood resins, adhesives, acoustic insulation |
| Carbon Monoxide (CO) | Electrochemical Cell | $< 1\text{ ppm}$ | $> 9\text{ ppm}$ (8-hr avg) | Incomplete fuel combustion, loading docks, boilers |
Low-Cost Sensors vs. Reference-Grade Monitors: Accuracy, Standards, and Trade-Offs
Low-cost sensors (LCS) typically cost about 5% of what organizations spend on conventional Federal Reference Method (FRM) or Federal Equivalent Method (FEM) monitoring stations. This affordability allows facility managers and researchers to deploy dense spatial networks across expansive sites, capturing localized pollution gradients that a single central station might miss entirely.
However, low-cost optical and electrochemical components come with practical trade-offs:
- Sensor Drift: Over months of continuous field exposure, optical chambers accumulate dust on light lenses, while electrochemical cell electrolytes gradually dry out or become fouled.
- Environmental Sensitivity: High humidity can cause water droplets to scatter light inside optical chambers, leading low-cost particle counters to report elevated particulate spikes during foggy or humid conditions unless mathematical humidity correction curves are applied.
- Chemical Cross-Sensitivity: Low-cost MOX sensors respond broadly to diverse reducing and oxidizing gases, making it impossible to separate harmless ethanol vapors (such as hand sanitizer) from hazardous industrial solvents.
To bridge the gap between indicative data and actionable compliance, industry frameworks such as the RESET® Air Standard, WELL Building Standard™, and MCERTS certification evaluate sensor stability and establish field-calibration criteria.
By co-locating low-cost sensor nodes next to reference-grade monitors, data scientists apply multi-variable linear regression and machine learning models to adjust baseline slope and intercept values. While these calibrated arrays effectively guide operational decisions, identifying broader environmental liabilities, soil contamination, or historical structural hazards requires a professional environmental site assessment rather than automated sensor screening alone.
Strategic Deployment and Building Management System (BMS) Integration

A high-performance air sensor will yield unrepresentative data if installed in an improper location. Air quality sensors must be placed to sample the actual air volume occupants inhale, rather than stagnant microclimates.
Best Practices for Deploying Air Quality Monitoring Sensors
- Breathing-Zone Placement: Mount sensors between 3 and 6 feet (1.0 to 1.8 meters) above finished floor level. This captures representative occupant inhalation zones in offices, classrooms, and residential areas.
- Avoid Direct Disturbance Vectors: Never install monitors directly inside supply diffuser air jets, immediately adjacent to open exterior doors, near drafty window frames, or directly above localized thermal plumes (such as radiators, copiers, or coffee makers).
- Prevent Stagnant Dead Zones: Avoid dead-air pockets behind solid doors, inside deep structural alcoves, or directly against uninsulated exterior walls where thermal stratification prevents natural convective mixing.
- Implement Scheduled Maintenance Cycles: Regularly inspect optical intake fans for lint accumulation, execute zero-point baseline calibrations for NDIR $\text{CO}_2$ sensors in unoccupied spaces (targeting a $400\text{ ppm}$ ambient baseline), and replace exhausted electrochemical cartridges according to manufacturer life-cycle schedules (typically 2 to 5 years).
Integrating Sensor Telemetry with BMS Protocols
Connecting environmental sensors to automated mechanical infrastructure transforms passive data collection into active ventilation management. Integrating real-time sensor arrays via standard building protocols (such as BACnet MS/TP, BACnet/IP, or Modbus RTU) allows Building Management Systems to implement Demand-Controlled Ventilation (DCV):
- Demand-Controlled Outdoor Air Dampers: As indoor occupant density increases and NDIR sensors register $\text{CO}_2$ concentrations approaching $800 – 1,000\text{ ppm}$, the BMS modulates economizer dampers to draw in fresh outdoor air, preventing cognitive fatigue and reducing viral aerosol persistence.
- Dynamic Filtration Modulation: If laser particle counters detect fine particulate intrusion from outdoor traffic or dust events, the system automatically increases static pressure through Variable Frequency Drives (VFDs) and routes return air through higher-efficiency MERV filtration stages.
- Hazard Containment & Purge Cycles: When MOX or electrochemical arrays detect abnormal VOC or chemical spikes after hours, the BMS triggers localized high-volume exhaust purges without recirculating contaminated air throughout adjacent building zones.
For facility directors managing complex properties, these continuous sensor inputs complement full-scope environmental testing programs, providing real-time visibility between formal compliance audits.
Community Loan Programs and Environmental Justice Initiatives
Air sensor technology also plays an expanding role outside commercial automation. Regional environmental protection agencies, public library systems, and tribal organizations have pioneered community sensor loan programs.
By distributing low-cost, portable laser scattering monitors (such as AirBeam devices) to library patrons, students, and community members, these initiatives empower local residents to measure hyper-local particulate gradients, trace neighborhood traffic pollution, and monitor wildfire smoke penetration in areas that lack formal municipal monitoring stations.
Frequently Asked Questions About Air Quality Sensors
Can low-cost air quality sensors replace regulatory reference monitors?
No. Low-cost air sensors cannot replace Federal Reference Method (FRM) or Federal Equivalent Method (FEM) monitors for legal and regulatory enforcement. Regulated monitoring requires strict gravimetric sampling, continuous automated calibration validation, and climate-controlled shelter housing. Low-cost sensors serve as complementary tools that offer dense spatial coverage, pinpoint localized emission hotspots, and provide operational awareness between reference stations.
How often do multi-gas air quality sensors require calibration or replacement?
Maintenance intervals depend on sensor chemistry and operating conditions:
- NDIR $\text{CO}_2$ Sensors: Generally feature automated baseline calibration routines and operate reliably for 5 to 10 years without manual adjustment.
- Laser Scattering PM Modules: Often maintain baseline accuracy for 3 to 5 years, though high dust environments require periodic cleaning of the optical chamber.
- Electrochemical and MOX Gas Cells: Typically have finite operational lifespans of 1 to 3 years due to electrolyte depletion and chemical degradation, requiring scheduled recalibration or cartridge replacement.
What causes sudden indoor VOC and particulate spikes on consumer monitors?
Sudden indoor spikes are frequently triggered by normal, non-hazardous household and office activities. Aerosolized droplets from essential oil diffusers, frying food, peeling citrus fruits (which emit limonene), using alcohol-based hand sanitizers, vacuuming without a sealed HEPA exhaust, or unboxing new composite furniture can cause substantial readings on optical and MOX sensors. Analyzing the duration, co-occurring humidity levels, and human activities in the space helps distinguish benign temporary emissions from structural building hazards.
Moving from Sensor Data to Comprehensive Building Safety
Modern environmental sensors are valuable tools for tracking ventilation performance, identifying unexpected particulate increases, and optimizing everyday indoor climate control. They deliver continuous, immediate visibility into dynamic indoor environments.
However, electronic sensors cannot identify specific hazardous materials within your building’s fabric. A reading on an optical particle monitor cannot differentiate between harmless ambient dust, fungal spores, lead-paint particulate, or microscopic mineral fibers released during renovations. When physical building issues arise, automated sensors should serve as an initial operational signal that prompts professional on-site investigation.
With more than four decades of field experience across architectural, engineering, and environmental disciplines, G/A Environmental delivers targeted site investigations, laboratory-backed testing, and comprehensive asbestos inspection and management services to ensure your facilities remain safe, healthy, and fully compliant.