

Why Air Monitoring Matters
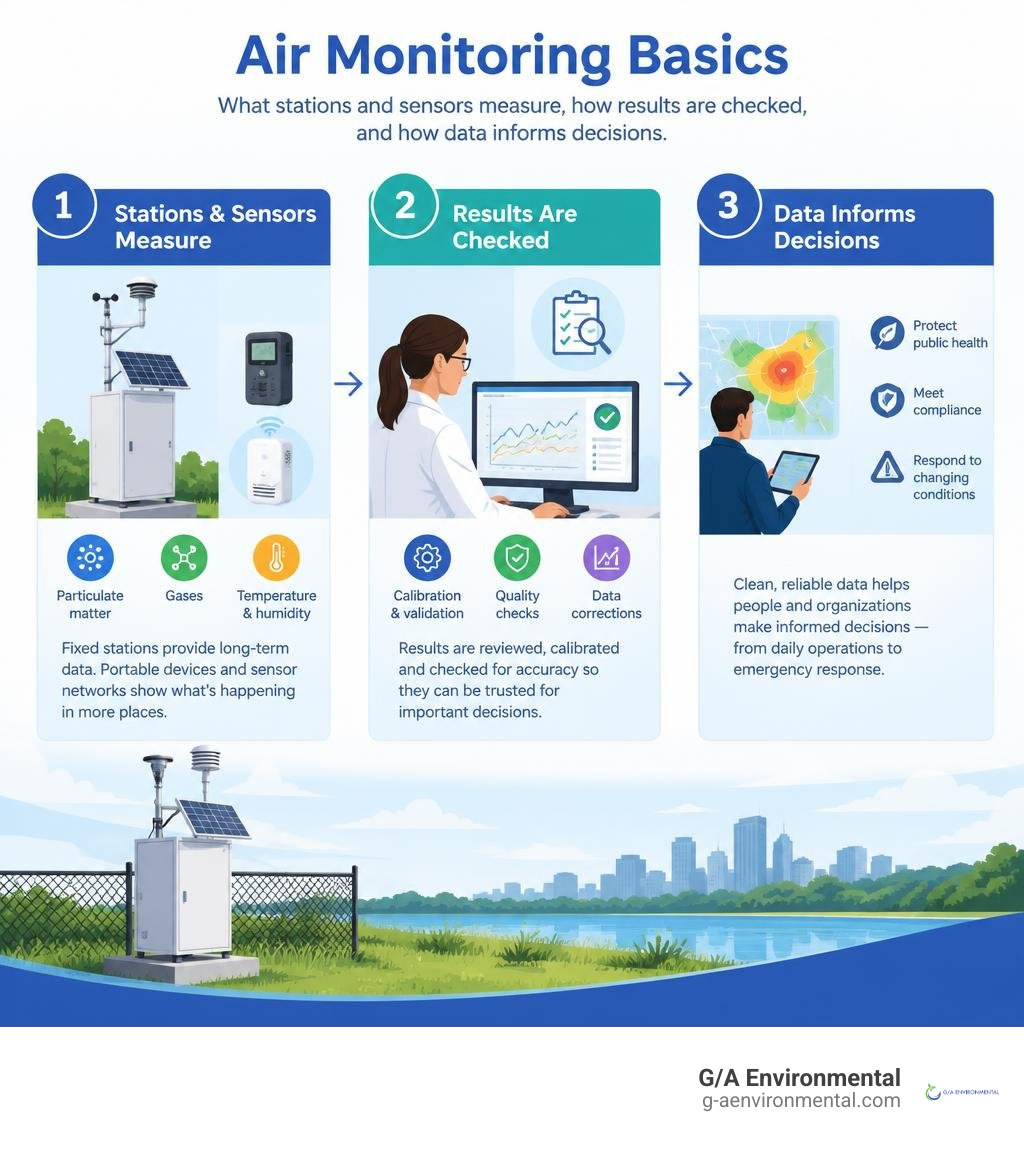
Air monitoring measures pollutants in the air so people can spot exposure risks, respond to changing conditions, and check compliance with air quality rules. Fixed stations provide reliable long-term data. Portable devices and sensor networks help show what is happening in more places, but their readings may need checks or corrections before they are used for major decisions.
That distinction matters during wildfire smoke and at properties where airborne hazards are a concern. The right method depends on what you need to measure and how you will use the results.
I’m Michael Otto, Managing Partner at G/A Environmental and a Texas-licensed asbestos and mold consultant. My work assessing hazards for building owners and schools shapes how I approach air monitoring: start with the risk, then choose a method that can answer the question.
Air monitoring word list:
Core Technologies and Methods in Air Monitoring
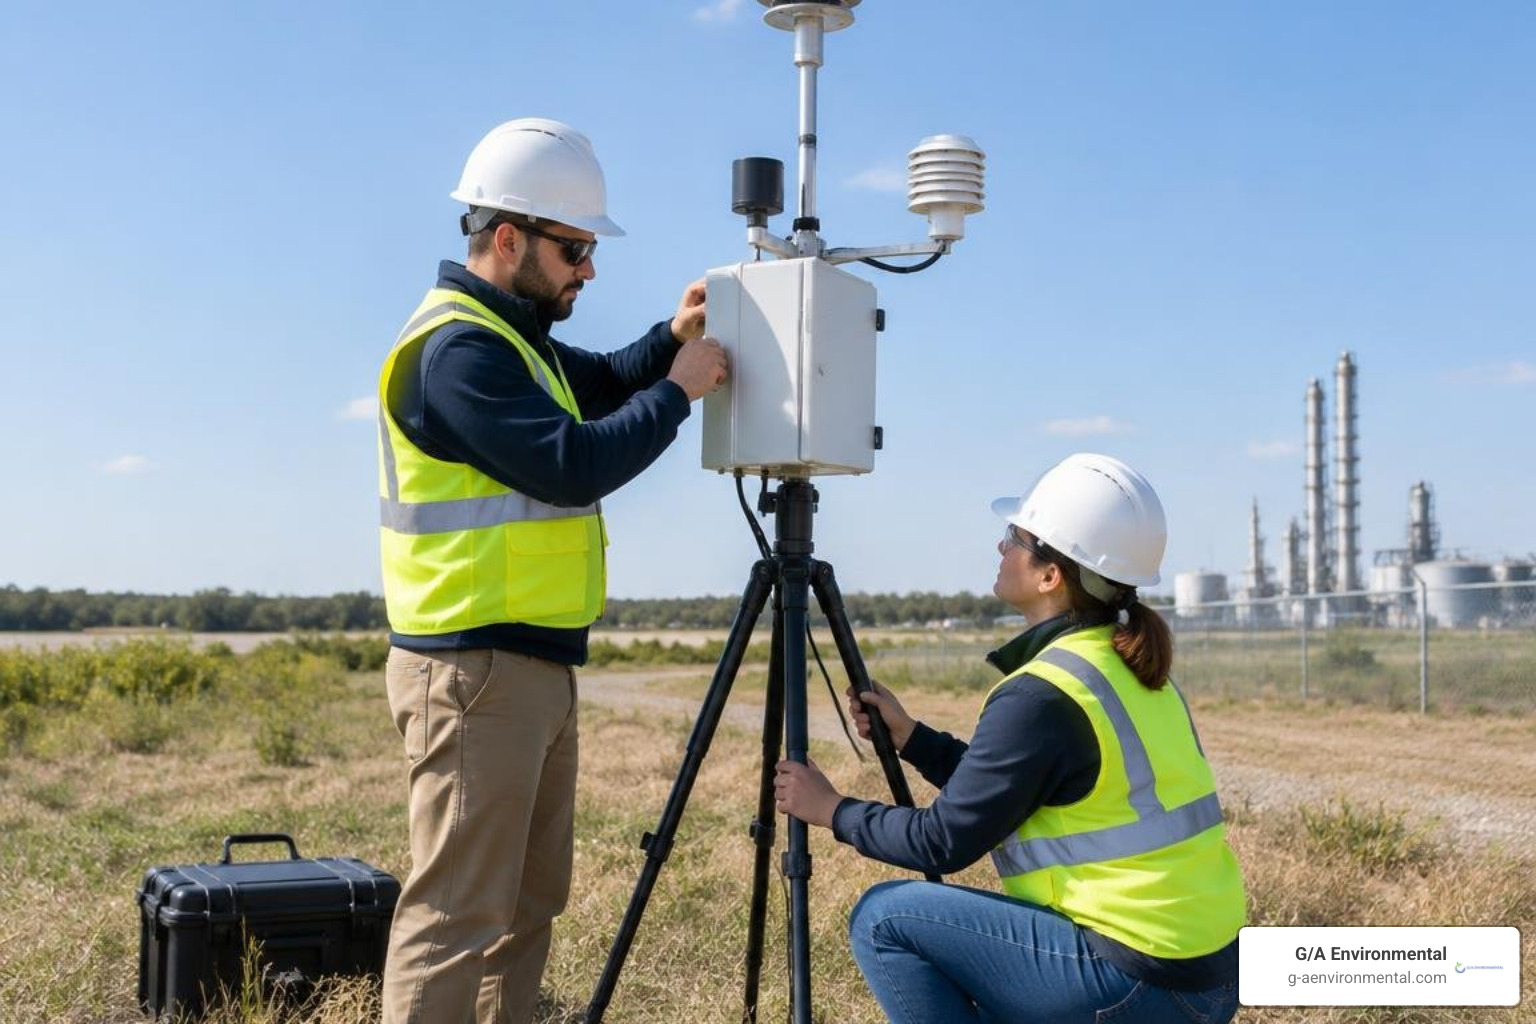
When we evaluate air quality across commercial sites, regional districts, or residential communities, selecting the right instrumentation is critical. Air monitoring technologies broadly fall into three categories: high-precision stationary stations, multi-pollutant sensor nodes, and long-range optical beams. Each tool serves distinct operational goals based on capital cost, sampling frequency, and required spatial resolution.
Understanding these differences ensures that environmental professionals deploy equipment suited to their exact regulatory or investigative scope. For a deeper operational look, review our guide to continuous ambient air monitoring practices.
| Monitoring Approach | Primary Technology | Key Advantages | Typical Limitations | Primary Use Case |
|---|---|---|---|---|
| Regulatory Stations | Gravimetric filters, Beta Attenuation Monitors (BAM), Chemiluminescence | Highest accuracy, legal defensibility, NAAQS compliance | High capital cost ($50k–$150k+), fixed siting | Regional compliance, State Implementation Plans (SIP) |
| Sensor Pods & Nodes | Optical Particle Counters (OPC), Electrochemical, Photoionization (PID) | Low cost, dense spatial grids, rapid deployment | Prone to drift, affected by humidity, requires calibration | Community networks, fence-line screening, wildfire tracking |
| Open-Path Systems | FTIR (Fourier Transform Infrared), DOAS (Differential Optical Absorption) | Long-path line-of-sight analysis, measures multi-gas plumes | High initial setup cost, optical line-of-sight required | Industrial perimeter monitoring, petrochemical fence-lines |
Regulatory-Grade Stations vs. Portable Air Quality Sensors
Regulatory air monitoring stations serve as the gold standard for public health data. Regulated by environmental authorities through Federal Reference Methods (FRM) and Federal Equivalent Methods (FEM), these permanent shelters house climate-controlled instruments that run continuous, automated sampling. For instance, state networks across Michigan and Ohio operate over 40 distinct locations with more than 100 dedicated air monitors to verify compliance with National Ambient Air Quality Standards (NAAQS).
In contrast, portable and low-cost sensor nodes rely on micro-optical particle counters (OPCs) and compact electrochemical cells. These compact devices—often deployed in community grids of over 35,000 active nodes globally—fill spatial data gaps where multi-thousand-dollar monitoring stations cannot fit. However, raw sensor outputs can drift due to seasonal weather shifts and high relative humidity. Learning how to properly manage these devices is essential; discover more about interpreting air sensor diagnostics to keep your localized data reliable.
Open-Path Systems and Advanced Optical Spectroscopy
For large industrial perimeters, chemical storage terminals, and expansive remediation operations, point-source sensors may miss a narrow gas plume drifting across property boundaries. This is where open-path spectroscopy excels.
Technologies like Differential Optical Absorption Spectroscopy (DOAS) and Fourier-Transform Infrared (FTIR) spectroscopy project light beams across distances spanning several hundred meters to a retroreflector. By measuring how specific wavelengths of ultraviolet, visible, or infrared light are absorbed along the open atmospheric path, these analyzers deliver path-integrated gas concentrations in real time. For detailed technical frameworks governing these methodologies, consult the UK ambient monitoring techniques and standards regarding optical path verifications.
Critical Pollutants and Standard Measurement Techniques
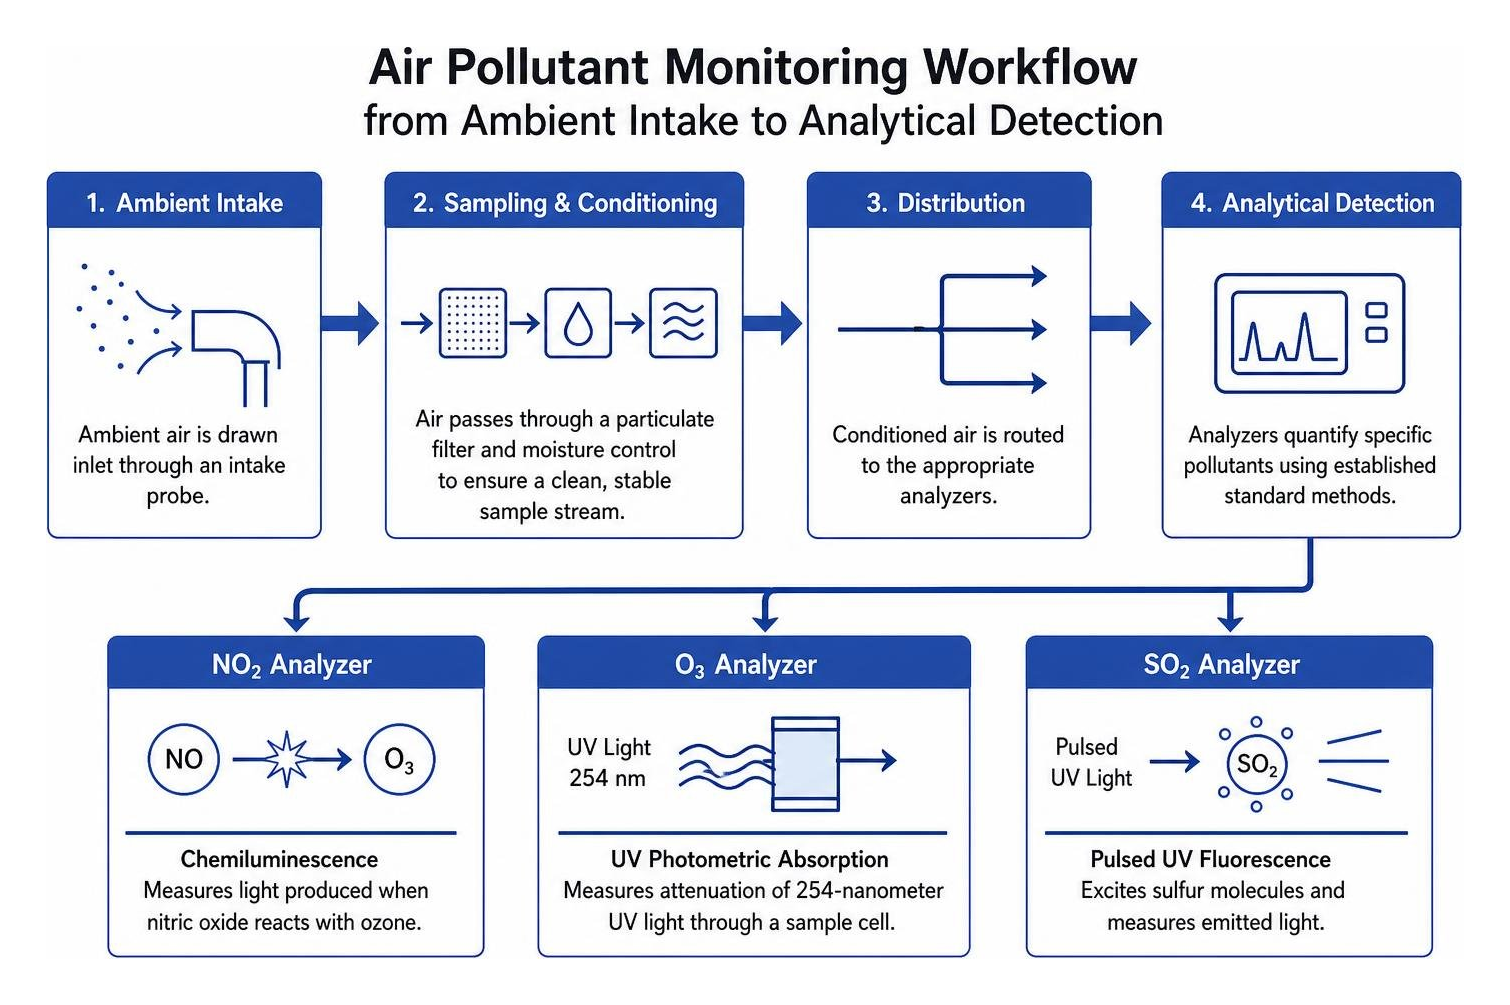
Air monitoring focuses heavily on criteria air pollutants—substances known to harm human health and the environment. Standard measurement techniques ensure that data gathered across municipal networks and industrial operations remain uniform and scientifically verifiable.
- Nitrogen Dioxide (NO₂): Measured continuously using chemiluminescence analyzers, which quantify the light produced when nitric oxide reacts with ozone.
- Ground-Level Ozone (O₃): Quantified through ultraviolet (UV) photometric absorption, tracking the attenuation of 254-nanometer light through a sample cell.
- Sulfur Dioxide (SO₂): Analyzed via pulsed UV fluorescence, exciting sulfur molecules and measuring secondary light emission.
- Carbon Monoxide (CO): Evaluated through Non-Dispersive Infrared (NDIR) gas analyzers, which measure gas absorption within targeted infrared spectrum bands.
Particulate Matter and Criteria Air Pollutants
Particulate matter is classified by its aerodynamic diameter:
- PM10 (Coarse particles): Inhalable dust, pollen, and mechanical abrasion particles under 10 micrometers.
- PM2.5 (Fine particles): Combustion particles, smoke, and chemical aerosols under 2.5 micrometers that penetrate deep into alveolar lung tissue.
Standard regulatory verification relies on automated Beta Attenuation Monitors (BAM) and tapered element oscillating microbalances, alongside periodic manual gravimetric sampling on pre-weighed Teflon or quartz filters. In automated BAM units, ambient air passes through a size-selective inlet and collects on filter tape; the instrument then measures the absorption of beta radiation through the spot to determine particle mass concentration in micrograms per cubic meter.
Industrial Air Monitoring for Toxics and Hazardous Fibers
Beyond criteria gases, industrial and facility renovation projects often generate hazardous air pollutants that require specialized sampling protocols:
- Volatile Organic Compounds (VOCs): Handled through Photoionization Detectors (PID) for real-time total VOC screening, paired with sorbent tube collection and gas chromatography-mass spectrometry (GC-MS) for compound-specific analysis like benzene.
- Heavy Metals: Sampled via high-volume or low-volume pumped air onto mixed cellulose ester or quartz filters, followed by laboratory ICP-MS testing according to established site lead testing protocols.
- Asbestos Fibers: Regulated under strict clearance criteria, requiring high-volume air pumps drawing air across membrane filters, analyzed via Phase-Contrast Microscopy (PCM) for rapid fiber counting or Transmission Electron Microscopy (TEM) to resolve ultrafine mineral structures during professional asbestos inspections.
- Chemical Agents and Toxic Vapors: Evaluated using automated near-real-time gas chromatography and miniature continuous air monitoring systems aligned with CDC chemical agent monitoring guidelines.
Wildfire Smoke Measurement and Emergency Response Systems

Wildfire smoke events generate massive concentrations of fine particulate matter (PM2.5), volatile organic vapors, and carbon monoxide that can overwhelm standard municipal networks. Because smoke plumes shift rapidly with changing winds, stationary stations alone cannot provide full geographic coverage during fire seasons.
The EPA and partnering agencies combat this through the AirNow Fire and Smoke Map, which merges regulatory-grade monitors with thousands of publicly and privately hosted small sensors, providing continuous, localized exposure estimates to the public.
Mobile Units, Drones, and Sensor Loan Programs
When wildland fires ignite, environmental agencies deploy specialized rapid-response tools to quantify emissions at the source:
- Uncrewed Aircraft Systems (Drones): Drones equipped with lightweight multi-pollutant sensor packages—such as the Kolibri system—fly directly into active smoke plumes to collect vertical profiles of particulate density and emission factors without endangering flight crews.
- Mobile Monitoring Trailers: Rapidly towable shelters equipped with continuous optical monitors and meteorological masts fill monitoring voids downwind of fires.
- Sensor Loan Initiatives: Programs such as the Wildfire Smoke Air Monitoring Response Technology (WSMART) loan commercial-grade sensor arrays and portable filter samplers to state, local, and tribal authorities during active emergencies. Review ongoing field trials via EPA wildland fire smoke measurement research.
Correcting Sensor Artifacts for Real-Time Public Health Maps
Low-cost optical particle sensors estimate particulate mass by illuminating airborne particles with a laser and measuring the scattered light. However, during heavy wildfire smoke events, two primary challenges arise:
- High Relative Humidity: Airborne moisture causes hygroscopic smoke particles to swell, making them scatter more light and causing sensors to overestimate particulate mass.
- Variations in Particle Refractive Index: Wood-smoke particles possess different optical properties and densities compared to standard urban mineral dust.
To correct these artifacts, researchers developed mathematical correction equations that adjust raw sensor data based on ambient relative humidity and historical co-location tests against regulatory reference monitors. Implementing these correction equations ensures the public receives reliable, actionable Air Quality Index values.
Quality Assurance, Calibration, and Long-Term Network Maintenance
Uncalibrated air sensors can deliver misleading data. Establishing legally defensible air quality datasets requires strict Quality Assurance Project Plans (QAPP), routine instrument maintenance, and traceable validation protocols. These rigorous standards form the backbone of both municipal air networks and our comprehensive environmental site assessments.
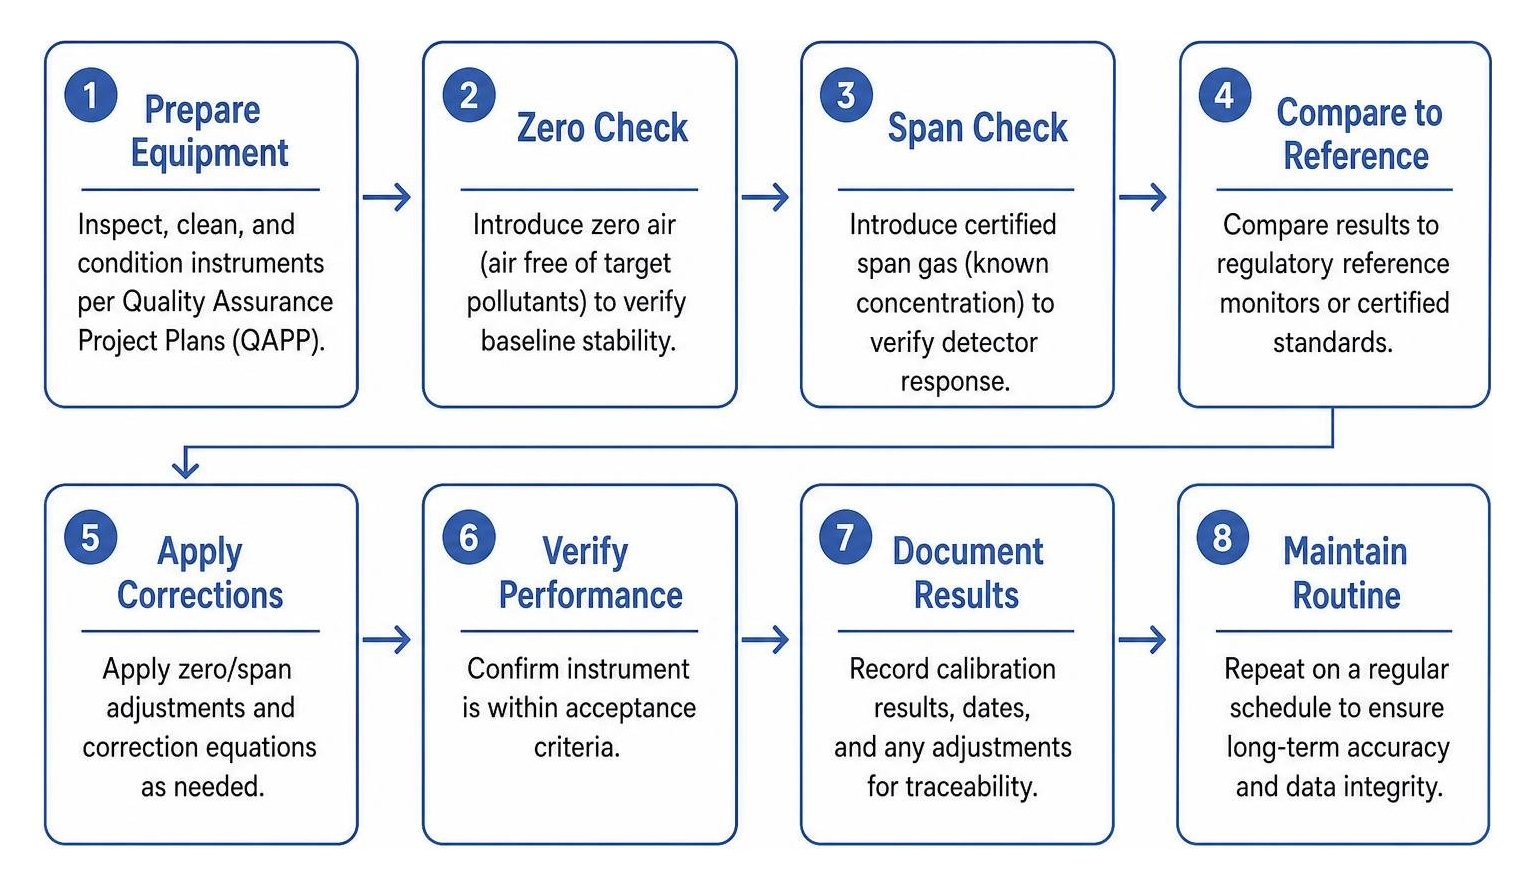
Routine Calibration Protocols for Air Monitoring Networks
Maintaining continuous accuracy across gas and particulate monitors involves multi-tiered quality control checks:
- Zero and Span Verifications: Gas analyzers undergo automated or manual checks where zero air (air free of target pollutants) and certified span gas (known pollutant concentration) are introduced to verify baseline stability and detector response.
- Flow Rate Audits: Particulate samplers require periodic volumetric flow audits using NIST-traceable calibrators to confirm sample flow remains within regulatory specifications (typically within plus or minus 4 percent).
- Sensor Co-Location: Optical and electrochemical sensor pods are physically co-located adjacent to certified FEM monitors for several weeks, allowing technicians to calculate linear regression values and apply field correction factors.
- Detector Maintenance: Photoionization detector lamps require regular cleaning every 3 to 6 months to remove organic films, while electrochemical cells are scheduled for replacement every 2 to 3 years before sensitivity degrades.
Compliance Standards and Federal Quality Control Frameworks
Regulatory ambient networks operate under federal quality assurance mandates, such as EPA 40 CFR Part 58. These rules dictate precision standards, data completeness thresholds (typically requiring at least 75 percent valid hourly data points per quarter), and annual network design reviews.
Similarly, indoor air quality projects and building remediations must comply with strict federal statutes. For example, school districts and commercial facility operators rely on our team to satisfy AHERA regulatory compliance requirements, ensuring that containment air pumps, baseline samples, and final clearance tests meet all legal thresholds.
Frequently Asked Questions About Air Quality Testing
How does the Air Quality Index (AQI) interpret real-time pollution data?
The Air Quality Index (AQI) translates complex pollutant concentration numbers into a standardized scale from 0 to 500, broken into color-coded health risk tiers:
- 0 to 50 (Good – Green): Air quality is satisfactory, posing little to no health risk.
- 51 to 100 (Moderate – Yellow): Acceptable quality; very small numbers of unusually sensitive individuals may experience mild respiratory symptoms.
- 101 to 150 (Unhealthy for Sensitive Groups – Orange): Members of sensitive groups (children, older adults, people with asthma or heart conditions) may experience health effects.
- 151 to 200 (Unhealthy – Red): Some members of the general public may experience health effects; sensitive groups face more serious issues.
- 201 to 300 (Very Unhealthy – Purple): Health alert: the risk of health effects is elevated across the entire population.
- 301 to 500 (Hazardous – Maroon): Health warning of emergency conditions; everyone is likely to be affected.
The daily reported AQI reflects whichever criteria pollutant has the highest index value at that monitoring location.
What is the main difference between FRM and FEM monitoring equipment?
A Federal Reference Method (FRM) defines the primary baseline technique designated by regulatory agencies for measuring a specific pollutant (such as manual, 24-hour gravimetric filter collection for fine particulate matter).
A Federal Equivalent Method (FEM) utilizes an alternative, often automated technology—such as continuous Beta Attenuation Monitoring or continuous optical spectroscopy—that has been rigorously tested and proven to achieve statistical parity with FRM standards. Both FRM and FEM datasets are legally binding for regulatory enforcement and attainment determinations.
Why do optical sensors require correction equations during wildfire smoke events?
Optical sensors estimate particle concentrations by measuring light scattering across an internal laser beam. Because smoke particles absorb and scatter light differently than coarse road dust, and because high humidity causes smoke particles to absorb moisture and swell, unadjusted optical sensors can overestimate fine particulate levels by a factor of two or more during dense smoke events. Applying empirical correction equations aligns the raw optical readings with true gravimetric mass concentrations.
Conclusion
Whether managing wildfire smoke response, tracking industrial emissions, or conducting indoor clearance tests, effective air monitoring relies on using the right equipment for the job. Combining regulatory-grade baseline stations with agile, calibrated sensor networks delivers the comprehensive data needed to safeguard public health and maintain regulatory compliance.
For facility owners, school administrators, and project managers facing complex airborne hazard challenges, our multidisciplinary team brings over 40 years of integrated environmental engineering, testing, and consulting experience. Contact us today for expert environmental consulting and asbestos management from G/A Environmental.